flowchart TD
A[RAG Evaluation] --> B[Retrieval Quality]
A --> C[Generation Quality]
A --> D[End-to-End Evaluation]
B --> E[Precision, Recall, F-score,<br> NDCG, MRR...]
C --> F[Accuracy, Faithfulness,<br> Relevance, ROUGE/BLEU/METEOR,<br> Hallucination...]
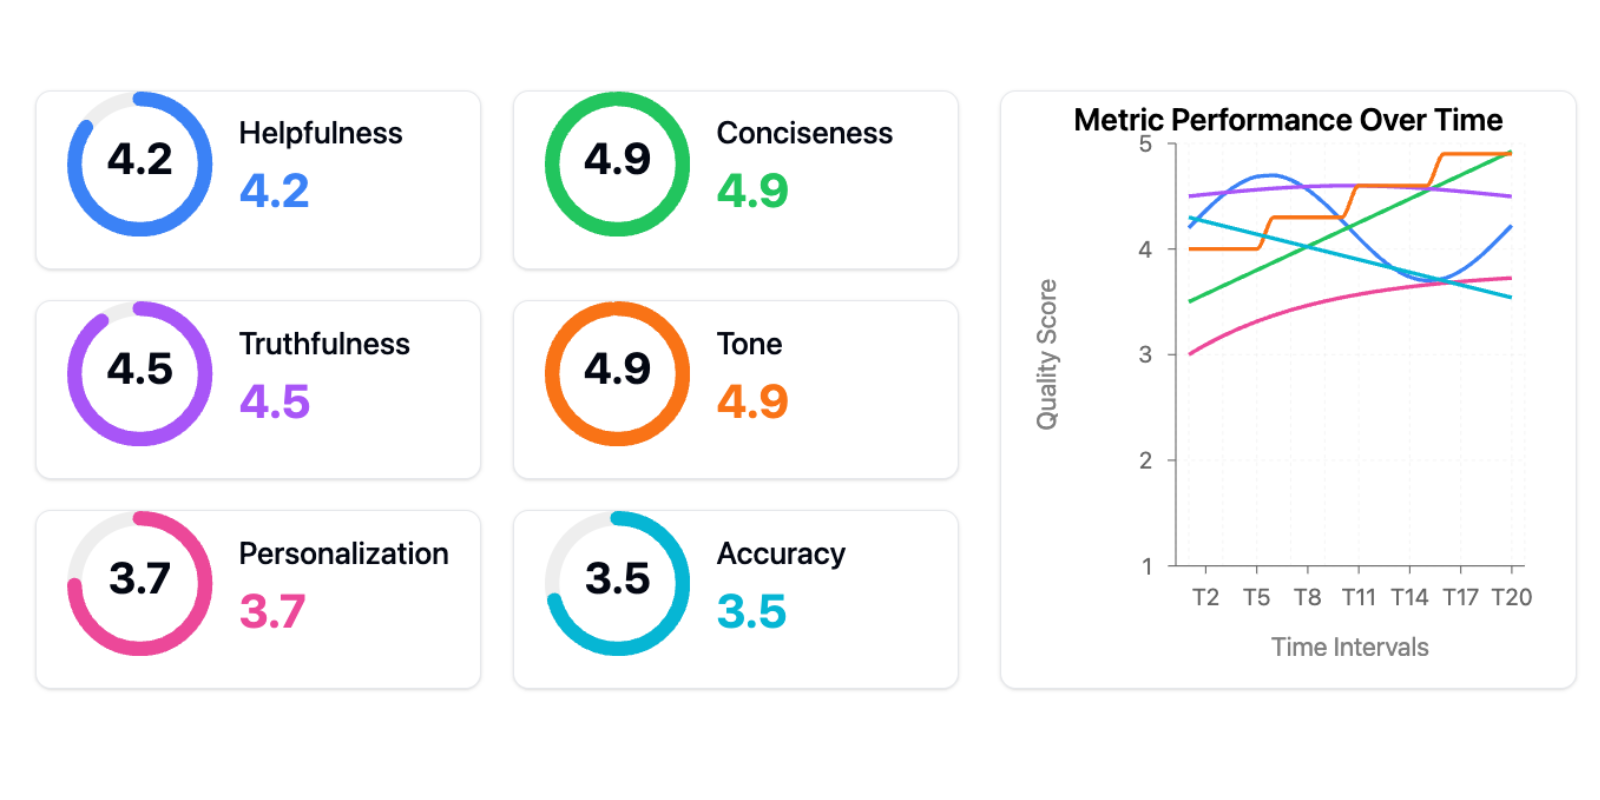
D --> G[Helpfulness, Consistency,<br> Conciseness,<br> Latency, Satisfaction...]
Challenges and insights in developing and evaluating RAG assistants
Generative AI and Official Statistics Workshop 2025
12/05/2025
Initial example

Is this a good answer ? Hard to tell
Initial example


Both answers are better: precise, contextual
Typical RAG pipeline

Challenge
- How should we parse the documents ?
- How to handle tables?
- How to handle documents metadata that can be useful ?
- Should we split the pages ?
- How long should each chunk be ?
- How should we chunk ?
- …

Challenge
- Which embedding should I choose ?
- Is the best performing embedding in MTEB relevant for my use case ?
- Which backend should I use for embedding ? (VLLM, Ollama…)
- Which vector database should I use ? (ChromaDB, QDrant…)
- How to make my vectordatabase always available to my RAG in production ?
- Should I only use semantic search or hybrid search ?
- How many documents should I retrieve ?
- Should I rerank ? How ?
- …

Challenge
- Which generative model should I use ?
- How to prompt it to ensure context citation and avoid hallucinations ?
- How to prompt it if there are different use cases that are covered ?
- Which backend should I use ?
- How to expose him to clients ? Should I expose him first to happy fews?
- …

They are not that much helpful
- RAG quality depends on so many dimensions…
- … we understood Kierkegaard’s vertigo of freedom concept

We need to know what we want
- Best way to go forward : read Hamel Husain blog
- Better to start with limited set of metrics
1. Collect expert level annotations
To challenge retrieval before any product launch
