Construire un pipeline de machine learning
Une introduction aux enjeux de mise en production
Introduction
Qui suis-je ?
- Data scientist au lab de l’Insee :
- Administrateur Insee ;
- Coordonnateur d’un réseau de data scientists
- Accompagnement de projets data science ;
Qui suis-je ?
D’autres cours que je donne à l’ENSAE ou l’Insee peuvent vous intéresser:
Pythonpour la data science ;- Mise en production de projets data science ;
- Bonnes pratiques en
RetGit; - Données émergentes ;
Et surtout consultez le portail complet de formation du datalab de l’Insee
Plan
- 1️⃣ Evolutions récentes de l’écosystème de la donnée ;
- 2️⃣ Pourquoi parler de mise en production ?
- 3️⃣ Création d’un pipeline sur données de transactions immobilières ;
- 4️⃣ Enjeux de la mise en production par le biais d’une API
- 5️⃣ APIfication de notre modèle de prix ;
- 6️⃣ Comment aller plus loin ?
- 🚀
Objectifs pédagogiques
- Comprendre les implications pratiques de l’utilisation accrue du machine learning pour la modélisation ;
- Construire un pipeline de machine learning avec ;
- Découvrir la mise à disposition de modèles sous forme d’API:
- Être à la page de la pratique moderne de la data science.
Contexte
Prolifération des données
- Numérisation et innovations technologiques ont réduit le coût de production de la donnée ;
- Volume de données produites en explosion
- L’utilisation des statistiques n’est pas nouvelle (cf. Desrosières)…
Diversification des données
- Des données de nature très différentes:
- Données structurées classiques ;
- Données géolocalisées ;
- Données textuelles et non structurées ;
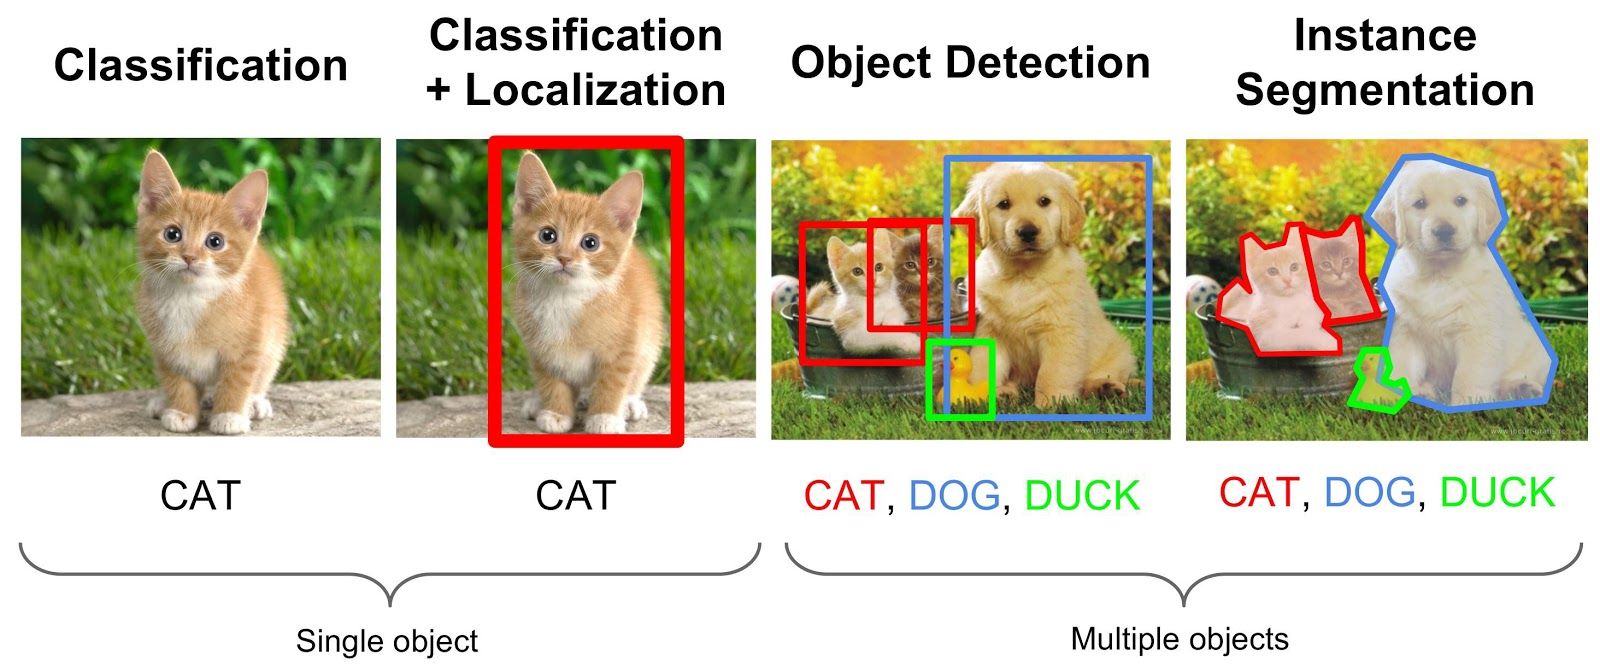
- Images, sons et vidéos.
- Besoin de nouvelles méthodes pour valoriser ces données :
- Machine learning (re)devenu un outil classique ;
- Réseaux de neurone pour les problèmes complexes (NLP, CV)…
Pourquoi le machine learning ?
- Meilleure prise en compte des non-linéarités que statistique paramétrique ;
- Simplicité à mise en oeuvre opérationnelle ;
- …
Diversification des données (1/4)
Données tabulaires classiques
info_mutations == "Tableau" ? html`<div>${table_mutations1}<div>` : html`<div>${plot_mutations}<div>`url = "https://files.data.gouv.fr/geo-dvf/latest/csv/2020/communes/92/92049.csv"
proxy = "https://corsproxy.io/?"
dvf = d3.csv(proxy + url)table_mutations1 = Inputs.table(dvf, {"columns": ['date_mutation', 'valeur_fonciere', 'adresse_nom_voie']})
plot_mutations = Plot.plot({
y: {grid: true, label: "Nombre de transactions"},
x: {
ticks: 12,
transform: (d) => Math.pow(10, d),
type: "log",
tickFormat: "~s",
label: "Prix (échelle log) →"
},
marks: [
Plot.rectY(
dvf.filter(d => d.valeur_fonciere > 10000),
Plot.binX({y: "count"},
{
x: d => Math.log10(d.valeur_fonciere),
tip: true
})
),
Plot.ruleY([0])
]
})Diversification des données (1/4)
Données tabulaires classiques
- Données structurées sous forme de tableau

Source: Hadley Wickham, R for data science
- très bien outillé pour ces données (si volumétrie adaptée)
Diversification des données (2/4)
Données géolocalisées
info_power_plants == "Tableau" ? html`<div>${table_power_plants}<div>` : html`<div>${plot_power_plants}<div>`import {us_power_plants, states} from "@observablehq/build-your-first-map-with-observable-plot"
table_power_plants = Inputs.table(
us_power_plants
)
plot_power_plants = Plot.plot({
projection: "albers-usa",
marks: [
Plot.geo(states, { fill: "white", stroke: "#e2e2e2" }),
Plot.dot(us_power_plants, {
x: "longitude",
y: "latitude",
r: "Total_MW",
fill: "PrimSource",
opacity: 0.7,
tip: true
}),
Plot.dot(us_power_plants, { // Can you figure out what this additional Plot.dot layer adds?
x: "longitude",
y: "latitude",
r: "Total_MW",
fill: "PrimSource",
stroke: "black",
filter: d => d.Total_MW > 3500,
}),
Plot.text(us_power_plants, { // Add text to the map using data from us_power_plants
x: "longitude", // Place text horizontally at plant longitude
y: "latitude", // Place text vertically at plant latitude
text: "Plant_Name", // The text that appears is the value from the Plant_Name column,
filter: (d) => d.Total_MW > 3500, // Only add text for plants with capacity exceeding 3500 MW
fontSize: 12, // Increased font size
fontWeight: 600, // Increased font weight
stroke: "white", // Adds white outer stroke to text (for readability)
fill: "black", // Text fill color
textAnchor: "start", // Left align text with the x- and y-coordinates
dx: 15 // Shifts text to the right (starting from left alignment with coordinate)
})
],
r: { range: [1, 15] },
color: { legend: true },
height: 500,
width: 800,
margin: 50
})Diversification des données (2/4)
Données géolocalisées
- Données tabulaires avec une dimension spatiale supplémentaire
- Dimension géographique prend des formes multiples:
- Points, lignes, polygones…
- très bien outillé pour ces données (si volumétrie adaptée)
Diversification des données (3/4)
Données textuelles et non structurées
- Techniques statistiques anciennes (Levenshtein 1957, perceptron) ;
- Applications limitées jusqu’aux années 2010 ;
- Développement très rapide de la recherche :
- Collecte accrue : réseaux sociaux, enquêtes…
- Baisse coûts stockage & augmentation ressources traitement ;
- Nouvelles techniques statistiques: webscraping, LLM…
- Utilisation intensive dans l’administration, la recherche et le secteur privé
- Plus d’infos dans mon cours sur les données émergentes
Diversification des données (3/4)
Données textuelles et non structurées
- Les LLM bien sûr…
- … Mais pas que !
d3.json(urlApe).then(res => {
  var IC, results;

  ({ IC, ...results } = res);

  IC = parseFloat(IC);

  const rows = Object.values(results).map(obj => {
    return `
    <tr>
      <td>${obj.code} | ${obj.libelle}</td>
      <td>${obj.probabilite.toFixed(3)}</td>
    </tr>
  `;
  }).join('');

  const confidenceRow = `<tr>
    <td colspan="2" style="text-align:left; "><em>Indice de confiance : ${IC.toFixed(3)}</em></td>
  </tr>`;

  const tableHTML = html`
  <table>
    <caption>
      Prédiction de l'activité
    </caption>
    <tr>
      <th style="text-align:center;">Libellé (NA2008)</th>
      <th>Probabilité</th>
    </tr>
      ${rows}
      ${confidenceRow}
  </table>`;

  // Now you can use the tableHTML as needed, for example, inserting it into the DOM.
  // For example, assuming you have a container with the id "tableContainer":
  return tableHTML;
});Diversification des données (4/4)
Images, sons et vidéos

Plus d’infos dans ce cours sur les données émergentes que je donne avec Tom Seimandi
Diversité des méthodes de machine learning
- Dispose-t-on de données labellisées ou pas ?
- Apprentissage supervisé vs non supervisé ;
- Question évaluation ex post des modèles: labellisation
- Quelle variable d’intérêt dans un cadre supervisé ?
- Régression vs classification
- Quels algorithmes choisir ?
Diversité des méthodes de machine learning

Scikit-Learn: un point d’entrée unifié
- La librairie de référence pour le ML
- Développée par l’Inria 🇫🇷🐓
- Toutes les étapes d’un pipeline basique
- Préparation des données: train/test split, imputation, standardisation, etc.
- Estimation: toutes les méthodes ont la même structure
- Evaluation: métriques de performance, validation croisée, etc.
- Structure formelle de pipeline
- Facilitera la mise en production
Pourquoi la mise en production
Pourquoi ?

Pourquoi ?

- Les data scientists ne connaissent pas le développement applicatif (mais en cours d’évolution) ;
- Les informaticiens classiques (devs & ops) ne connaissent pas le machine learning.
Contexte
- Difficulté de passer des expérimentations à la mise en production de modèle de machine learning
- Tirer parti des meilleures pratiques en génie logiciel:
- Améliorer la reproductibilité des analyses
- Déployer des applications de manière robuste
- Surveiller les applications en cours d’exécution
Le data scientist moderne
L’activité du data scientist tend à se rapprocher de celle du développeur :
projets intenses en code
projets collaboratifs et de grande envergure
complexification des données et des infrastructures
déploiement d’applications pour valoriser les analyses
L’approche DevOps
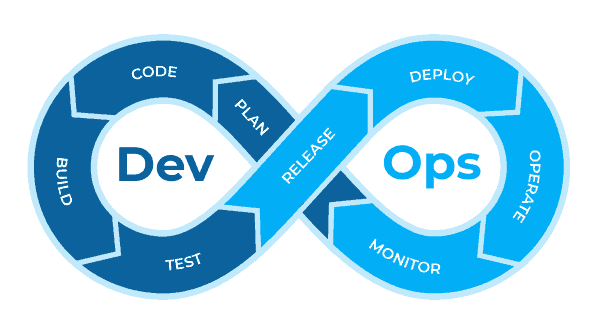
- Unifier le développement (dev) et l’administration système (ops)
- Réduire le temps de développement
- Maintenir la qualité logicielle

L’approche MLOps
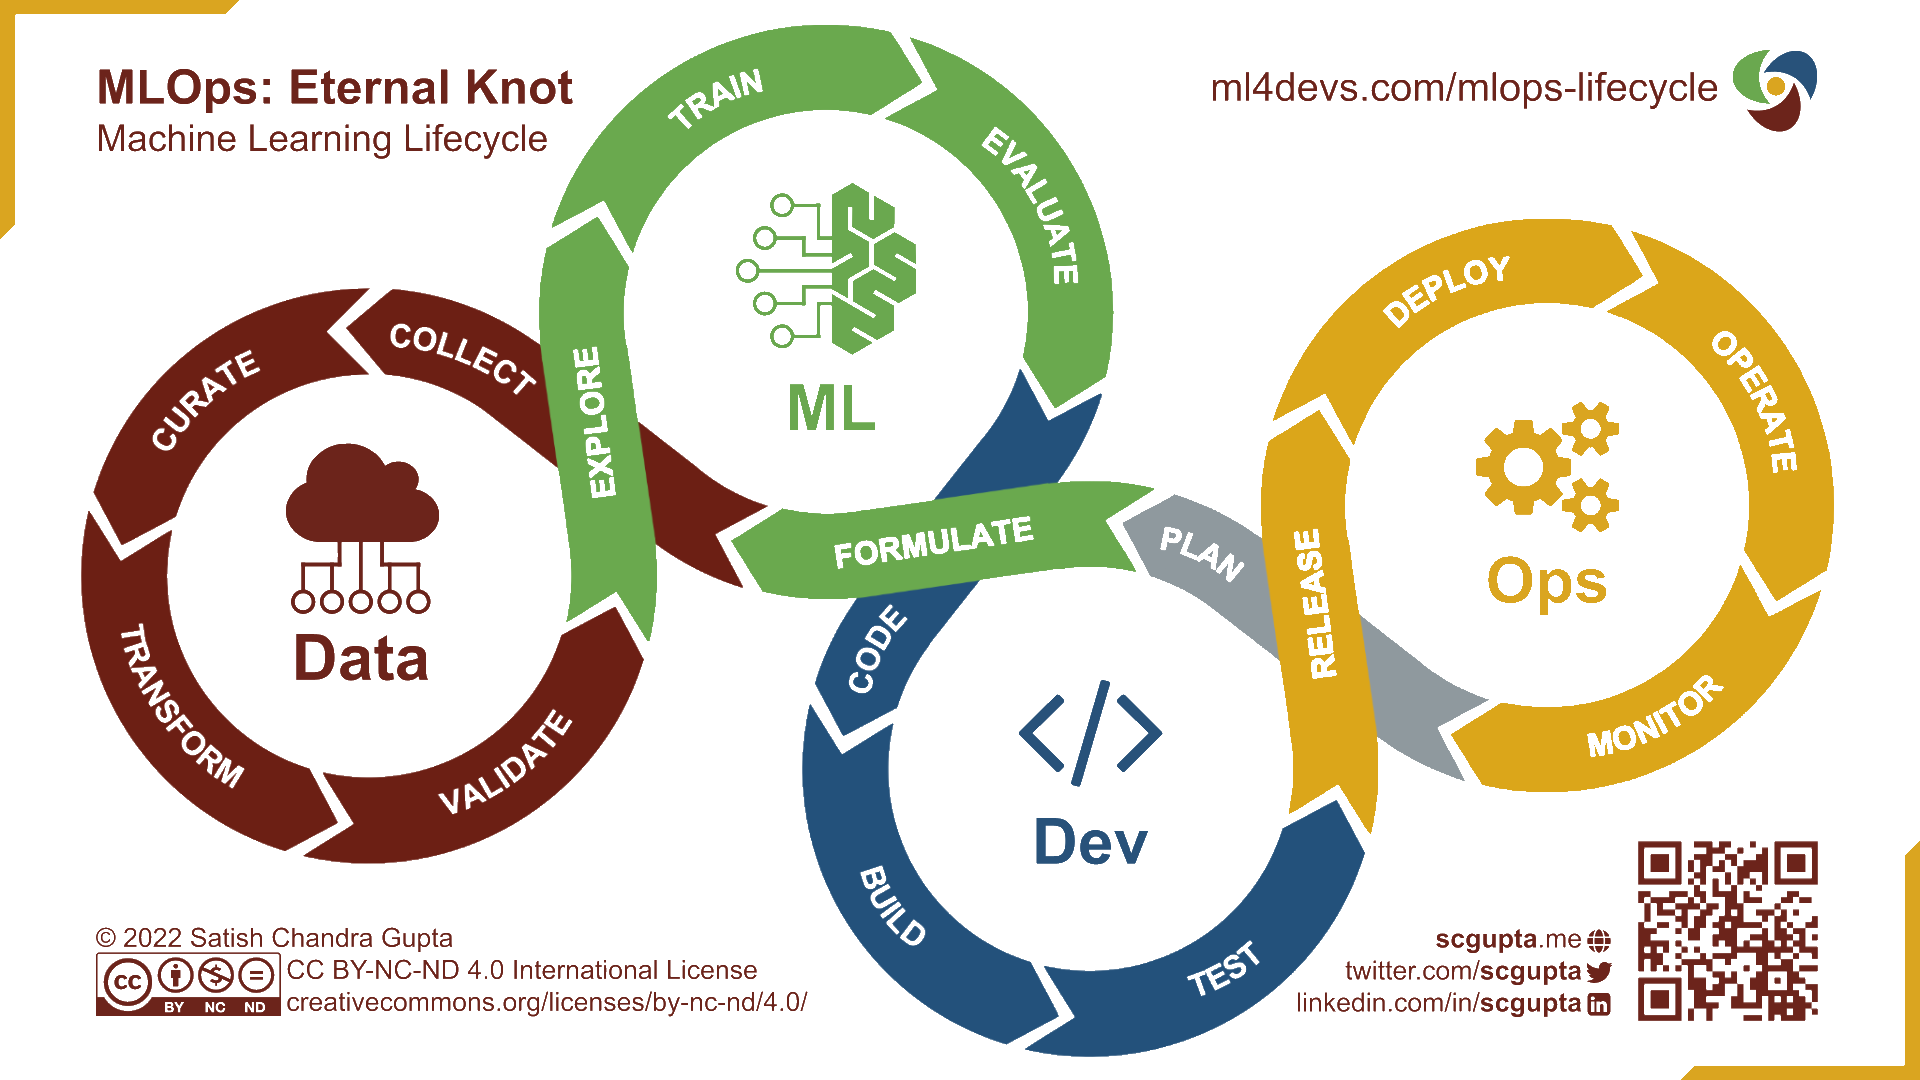
- Intégrer les spécificités des projets de machine learning
- Expérimentation
- Amélioration continue

DevOps, DataOps, MLOps ?
Le DevOps n’intègre pas les spécificités liées à la data science ;
DataOps : déploiement et maintenance de pipelines de données ;
MLOps : déploiement et maintenance de modèles de Machine Learning ;
Note
Les bonnes pratiques favorisent la collaboration et facilitent les déploiements.
La notion de mise en production
Définition
- Mettre en production : faire vivre une application dans l’espace de ses utilisateurs
- Notion simple mais mise en oeuvre compliquée !
- Dépasser le stade de l’expérimentation
- Bonnes pratiques de développement
- Techniques informatiques d’industrialisation
- Enjeu : pouvoir jouer le rôle d’interface entre métier et équipes techniques
- Evolution du métier de data scientist ;
- Spécificités du ML par rapport à un projet “classique”.
Application 1: pipeline de machine learning
Prise en main du SSP Cloud
Le SSP Cloud, c’est quoi ?

Le SSP Cloud, c’est quoi ?
- Des serveurs hébergés à l’Insee avec de nombreux logiciels statistiques (dont ) dessus
- Environnement ouvert à des formations en data science pour découvrir et expérimenter
- Seulement avec des données en open data
Note
Plus de détails dans la documentation du SSP Cloud
Pourquoi utiliser le SSP Cloud ?
Créer un compte
- Utiliser votre adresse mail universitaire pour créer un compte sur datalab.sspcloud.fr/
- Votre nom d’utilisateur ne doit contenir ni caractères accentués, ni caractère spécial, ni signe de ponctuation:
Vous pouvez adopter le format prenomnom en faisant attention aux règles précédentes. Par exemple, si vous vous appelez Jérôme-Gérard L’Hâltère, votre nom d’utilisateur pourra être jeromegerardlhaltere.
Application 1
- Objectifs:
- Modèle de prix sur données immobilières ;
- Feature engineering, validation croisée, etc. ;
- Découvrir les pipelines
Scikit;
- Direction 👉️ chapitre “Pipeline” de https://pythonds.linogaliana.fr
Avancer vers la mise en production d’un modèle 🚀
Vers la mise en production
- On a construit un projet de data science reproductible et conforme aux standards des bonnes pratiques.
- Pour valoriser le projet, il faut le déployer dans un environnement en lien avec les utilisateurs:
- Quel est le format adapté pour le valoriser ?
- Quelle infrastructure de production ?
- Comment automatiser le processus de déploiement ?
Format de valorisation
- Critères à prendre en compte :
- Quels sont les utilisateurs potentiels ?
- Seulement de la mise à disposition, ou besoin d’interactivité ?
- Spécificités ML : entraînement en batch ou online ?
- Besoin de scalabilité ?
- Formats usuels : API, application web, dashboard, site internet, rapport automatisé…
Workflow classique
Progresser pas à pas pour faciliter l’utilisation du modèle:
- Transformer les notebooks en script ;
- Créer une API en local avec pour faciliter le
predict; - Déployer l’API pour la rendre disponible à tous ;
- Greffer des applications clientes pour faciliter l’usage.
Note
Chaque étape est une progression dans l’échelle de la technicité et de la reproductibilité.
Exposer un modèle via une API REST
API : interface entre l’utilisateur (client) et le modèle entraîné
API REST : permet de requêter le modèle avec une syntaxe simple (HTTP) et de manière scalable

Développer une API en local
Etape 1: modulariser la consommation du modèle
- Scripts pour les différentes étapes du pipeline ML:
- Récupération des données ;
- Définition pipeline
Scikit: preprocessing, training ; - Consommation du modèle pour
predict.
- Définir une fonction qui prend en argument les variables du modèle
Exemple
def predict(
    month: int = 3,
    nombre_lots: int = 1,
    code_type_local: int = 2,
    nombre_pieces_principales: int = 3,
    surface: float = 75
) -> float:
    """
    """

    df = pd.DataFrame(
        {
            "month": [month],
            "Nombre_de_lots": [nombre_lots],
            "Code_type_local": [code_type_local],
            "Nombre_pieces_principales": [nombre_pieces_principales],
            "surface": [surface]
        }
    )

    prediction = model.predict(df)

    return prediction
Développer une API en local
Etape 2: créer une API en local
FastAPI: framework simple pour créer une API avec- Très simple de transformer fonctions en API ;
- Documentation automatisée pour le swagger
Exemple
@app.get("/predict", tags=["Predict"])
async def predict(
    month: int = 3,
    nombre_lots: int = 1,
    code_type_local: int = 2,
    nombre_pieces_principales: int = 3,
    surface: float = 75
) -> float:
    """
    """

    df = pd.DataFrame(
        {
            "month": [month],
            "Nombre_de_lots": [nombre_lots],
            "Code_type_local": [code_type_local],
            "Nombre_pieces_principales": [nombre_pieces_principales],
            "surface": [surface]
        }
    )

    prediction = model.predict(df)

    return prediction
Application 2
- Objectif:
- Développer une API pour consommer le modèle développé précédemment ;
- Direction 👉️ chapitre “API de machine learning” de https://pythonds.linogaliana.fr
Aller plus loin: automatiser la création de l’API
Limite de l’approche précédente
- L’entraînement et la création de l’API sont faits à la main:
- Approche artisanale jusqu’ici ;
- MLOps: passer à l’âge industriel.
- Automatiser :
- L’entraînement du modèle (voir formation MLOps de l’Insee) ;
- La création et le déploiement de l’API (voir cours mise en production de l’ENSAE).
- Le CI/CD adapté aux projets de machine learning.
CI/CD: kesako ?
- Intégration continue (CI) : à chaque modification du code source, l’application est automatiquement testée et reconstruite ;
- Déploiement continu (CD) : les nouvelles versions validées sont automatiquement mise à disposition aux utilisateurs.
Déployer une API
- Rendre disponible à d’autres utilisateurs l’API ;
- Nécessite une infrastructure:
- AWS, GCP, Azure…
- Infra
Kuberneteson premise
- Selon les organisations, pas forcément data scientist qui fait cela
- Mais, data scientist doit savoir échanger avec l’équipe qui déploie l’API.
Déployer une API
Exemple de réutilisation facilitée🚀
url_api_dvf = `https://dvf-simple-api.lab.sspcloud.fr/predict?month=4&nombre_lots=1&code_type_local=2&nombre_pieces_principales=${pieces_principales}&surface=${surface}`url_api_print = md`[<span class="blue-underlined">https://dvf-simple-api.lab.sspcloud.fr/predict?</span>month=4&nombre_lots=1&code_type_local=2&nombre_pieces_principales=<span class="blue-underlined">${pieces_principales}</span>&surface=<span class="blue-underlined">${surface}</span>](${url_api_dvf})`value = d3.json(url_api_dvf).then(data => {
// Access the 'value' property from the object
let originalNumber = data;
// Convert it to a floating-point number
let numericValue = parseFloat(originalNumber);
// Round the number
let roundedNumber = Math.round(numericValue).toLocaleString();
return roundedNumber;
}).catch(error => console.error('Error:', error));Conclusion
- Un pipeline bien pensé est facile à mettre en production
Scikit&FastAPI: combo 🔥 pour mettre à disposition un modèle ;
- En seulement 6 heures on a:
- Récupéré et nettoyé des données ;
- Créé un pipeline fonctionnel de machine learning,
- Crée une API pour mettre à disposition le modèle.
- On peut maintenant se concentrer sur l’amélioration de la qualité du modèle:
- Ouvre vers le MLOps: combiner modèle en production, modèles en développement, etc.
- Enjeux de monitoring de la qualité du modèle avec arrivée de nouvelles données.
Pour aller plus loin
Quelques ressources complémentaires
- Mise en production de projets data science (ENSAE, 3e année) ;
- Excellente formation au
MLOps(collègues de l’Insee 😉). - Me contacter:
Corrections:
PSL Data Week
